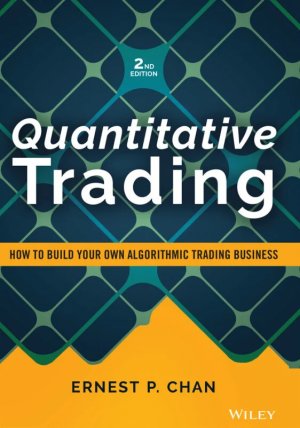
A guide for the independent trader: the backtest protocol and position sizing are worth the detour, the rest is about stocks, not crypto.
Why this book
Ernest P. Chan, a former researcher at IBM and in quantitative funds, went independent in early 2006 (lesson 43). His thesis: an individual can beat the big funds, with statistical discipline and contained risk. The book is a Wiley 2nd edition (2021), read as the ExpertEdge course version: 51 lessons, 4 h 16. Its key word is the backtest: replaying a strategy on past prices to see what it would have earned. Almost everything revolves around its reliability.
I do crypto algotrading in Python as a personal project: bots that run around the clock, with risk management: stop-loss (an automatic sale when the price falls below a threshold), trailing stop (a threshold that follows the price upward) and position sizing. Alongside that, four years of crypto fintech in Go, two of them writing automated trading algorithms for multi-exchange management mandates, with five exchanges (cryptocurrency trading platforms) to connect. Industrialization, I know. I wanted to see what the book says about knowing that a bot really wins, and not only on paper.
The ideas that stay
1Small capital, big edge
Why would an individual win against a multi-billion fund? Because of capacity, the amount of capital on which a strategy keeps good returns. For Chan, "it is far, far easier to generate a high Sharpe ratio trading a USD 100,000 account than a USD 100 million account" (lesson 43). The Sharpe ratio is the average return above the risk-free rate (what a safe investment pays), divided by volatility (how widely returns swing): 10% above that rate, with 10% volatility, gives 1.
The mechanism: low-capacity strategies play the market maker, offering to buy and sell at any moment (that is liquidity) and pocketing a small spread. With billions, you become the one demanding that liquidity, so the one paying, so you hold your positions for a long time and suffer regime changes (a lasting shift in the economic environment or in market rules).
2The truncation test against look-ahead
Look-ahead bias is an involuntary cheat in a backtest: using information that did not exist yet at the moment of the trade. The book's example: "buy within 1% of the day's low", when that low is only known at the close.
Chan's test: save the positions over the whole history (A), remove the last N days (10 to 100), rerun (B), cut the last N rows of A and compare. A gap proves the program uses the future: "the discrepancies in positions mean that you are inadvertently using the truncated part of the historical data" (lesson 15).
# My minimal version, not the book's
positions_a = strategy(prices)                 # full history
positions_b = strategy(prices.iloc[:-60])      # without the last 60 days
assert positions_a.iloc[:-60].equals(positions_b), "look-ahead: the future leaked"
Wire it in as a regression test in continuous integration.
A limit worth knowing, which I add to the book: this test catches a program that reads the following days, not a decision made with the current day's candle. The day's-low example slips through, since that low already exists in both histories. For that case, shift the signal by one period (signal.shift(1) in pandas): you decide today with yesterday's data.
3Five parameters, and enough data
Data-snooping bias means over-optimizing a strategy on the noise of the past. With 100 parameters, the history looks gorgeous and the future mediocre. Chan gives a rule: "I would not employ more than five parameters", entry and exit thresholds, holding period and moving-average window (the average of the latest prices) included (lesson 15). To check without fooling yourself, Chan splits the history: tune on the first part (training), then test on the second, never seen (the test).
You also need enough data points. The backtest Sharpe is measured on the past; the true Sharpe is the one the strategy will have live. According to Bailey, to be 95% sure the true Sharpe exceeds 0, a backtest Sharpe of 1 requires 681 points (2.71 years at one closing price per day), a Sharpe of 2 only 174. For a true Sharpe of at least 1, you need 1.5 in backtest and 2,739 points (almost 11 years). I would not carry these numbers over to other frequencies without redoing the calculation.
4Risk eats growth
A stock goes up or down 1% every minute, on a coin flip. Do you win, do you lose? Traders answer "flat", writes Chan, which is wrong: "you will lose money, at the rate of 0.005 percent" per minute (lesson 28). After +1% then -1%, 100 becomes 101 then 99.99: compound growth (that of a capital recomputed every period) equals the average return minus half the variance (the square of volatility). The book's conclusion: "risk always decreases long-term growth rate".
The Kelly criterion is the leverage (portfolio size divided by equity) that maximizes that growth: the average return above the risk-free rate, divided by the variance. Example: SPY, the fund that tracks the S&P 500, earns 7.231% above the risk-free rate for 16.91% volatility. Kelly says 2.528: with 100,000 dollars you buy 252,800, for 13.14% annual growth against 9.8% without leverage.
Kelly is recomputed at the end of every day. After a 10% loss, the 252,800 portfolio is worth 227,520: 74,720 of equity remain, the rest is borrowed. Kelly then aims for 2.528 times 74,720, that is 188,892: you must sell 38,628 of securities in the middle of the drop. Most traders therefore take half (half-Kelly), because it is "always safer to have a leverage below what the Kelly formula recommends" (lesson 28).
5Capping leverage by the worst loss
Kelly assumes returns follow a bell curve (normal distribution), where very large moves are nearly impossible, yet crashes are far more frequent. Hence the rule: "the leverage to use is always the smaller of the half-Kelly leverage and the maximum leverage obtained using the worst historical loss" (lesson 29). The S&P 500 lost 20.47% in one day, on October 19, 1987. If you tolerate a 20% loss in one day, the maximum leverage is 20% divided by 20.47%, about 1. Half-Kelly gives 2.528 divided by 2, that is 1.26: you keep the smaller, 1.
Selling at a loss has a collective effect: in January 2021, Melvin Capital lost 53% on GameStop, and every fund that deleverages pushes down the others' positions. For Chan, most disasters come from overleveraging, "not from an inherently erroneous model" (lesson 31). His instruction: succumb to neither despair nor greed.
6The stop-loss only helps in a trend
This one made me raise an eyebrow. For Chan, "it is a common fallacy to believe that imposing stop loss will prevent the portfolio from suffering catastrophic losses" (lesson 29). In case of a gap (a price that jumps from one level to another without passing between them), the order is executed far lower, and the stop merely realizes the loss.
He distinguishes two regimes. In momentum (the move keeps going), the stop helps. In mean reversion (the price returns toward its mean), the stop gets you out "at the worst possible time" (lesson 37). His criterion: a move with news is probably a trend; a move with no apparent reason often comes from a large holder who has to sell, and the price will come back.
Another argument: a fixed stop is an "extra adjustable parameter, which invites data-snooping bias" (lesson 37). Chan rather exits when the entry signal reverses: in momentum, that is the sign the trend has turned.
In mean reversion, he relies on the half-life, the expected time for the gap to shrink back by half, as the probable holding period. Example: about 10 days for GLD (the gold fund) against GDX (the gold miners fund). Taken alone, a price drifts further and further from its starting point. But buying 1 share of GLD and selling 1.631 shares of GDX gives a portfolio that stays around its mean: the two prices are said to be cointegrated (lessons 35 and 37).
7From backtest to live: paper first
Paper trading, a fictitious account at the broker, is according to Chan "practically the only way to see if your ATS software has bugs without losing a lot of real money" (lesson 26). You compare its trades with those of the backtest replayed on the same days: any gap not explained by costs probably signals a bug.
When live results disappoint, the diagnostic order: bugs, trades different from the backtest, execution costs, illiquid securities. That leaves the two dreaded causes, data-snooping (remove rules and parameters: if performance collapses, the bias is there) and regime change. When in doubt, it is better to lower the leverage of a losing model gradually than to switch it off at once (lesson 30). Semi-automatic trading (a program prepares the order list, you then send it through your broker's tool) keeps one advantage: you can sanity-check the orders before they go out, with the Knight Capital case in mind, which lost 440 million dollars to a faulty automatic order program (lesson 23).
My take, honestly
The book does not cover my ground. Its examples are stocks, ETFs (funds traded on an exchange that track an index) and futures (contracts to buy or sell at a fixed date), with one closing price per day, almost never crypto (a single mention, in a list of platforms) or a continuous market. Its industrialization targets an individual: Excel links, batch order submission through the broker, an hourly consultant. That is far below connecting to several exchanges, and I skip those lessons without regret. The code is written three times, MATLAB, Python and R, and the Python is dated (fillna(method='ffill')).
In the GLD/GDX example, the comment announces a training Sharpe of "about 2.3" while the MATLAB output shows 2.08. Another flaw: after declaring the strategy bias-free, Chan tightens the thresholds, sees the Sharpe ratios climb to 2.9 (training) and 3.0 (test), and concludes: "So, clearly, this set of thresholds is better" (lesson 15). He thus picks his settings after looking at the test, which his own rule advises against, even if he warns afterwards that optimization can degrade the test.
I keep the solid parts: the truncation test, the five parameters, the leverage cap, and the author's confession that he made his investors lose more than a million dollars by adding 100 million to a six-month-old strategy (lesson 30). On the stop-loss, I am not converted: a continuous market has fewer gaps than a stock closed overnight, and only a test on crypto data will say whether the thesis holds. My verdict, 6.0 out of 10: read lessons 15, 28 to 31 and 37, skim the rest.
Odilon
Still relevant in 2026?
The principles, yes: the protocol and the sizing do not depend on a technology. The universe (US stocks, MATLAB, Excel links) has aged.
Who is it for?
Read it if
- You write trading bots and want a protocol to know whether they really win.
- You set your position sizes by gut feeling and want a formula.
- You like an author who admits his own mistakes, with numbers.
Skip it if
- You are looking for crypto or 24/7 trading: the book barely covers it.
- You want production architecture or multi-exchange execution: this is individual-level material.
This book is part of ExpertEdge, Packt's subscription for technical books. The code ODILON50 takes 50% off the yearly plan: the book on ExpertEdge. Affiliate link: I earn a commission if you subscribe with this code, and my ratings don't depend on it.
For going further
- The TDD by Example note, by Kent Beck: the test before the code, the same reflex of checking before trusting.
- The Designing Data-Intensive Applications note, by Martin Kleppmann: the reliability of data systems, on the infrastructure side.
- The Building Full Stack DeFi Applications note, by Samuel Zhou: the other side of crypto, when the program is the marketplace.
Source: ExpertEdge course version (Wiley 2nd edition, 2021), lessons 3, 15, 23 to 26, 28 to 31 and 37 read in detail, the rest skimmed or unread (the passages cited from lessons 35 and 43 were checked against the text).
Comments (0)